Venn-manship

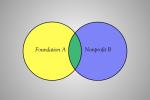
Hardly anybody remembers John Venn, a British mathematician from the late 1800s. But everybody has heard of Venn diagrams, maybe used them in charts to explain how one group of characteristics “overlaps” another, and to name and define the stuff in the place where the groups overlap. Circle A represents tall people, circle B represents athletes. When we overlap the circles we’ve got tall people who aren’t athletes, and athletes who aren’t tall—but in the overlap, we’ve got tall athletes.

